By Minda Cerva
MSCLE students in Ágnes Horvát‘s Culture and Arts Analytics class spent this fall quarter with numbers and science.
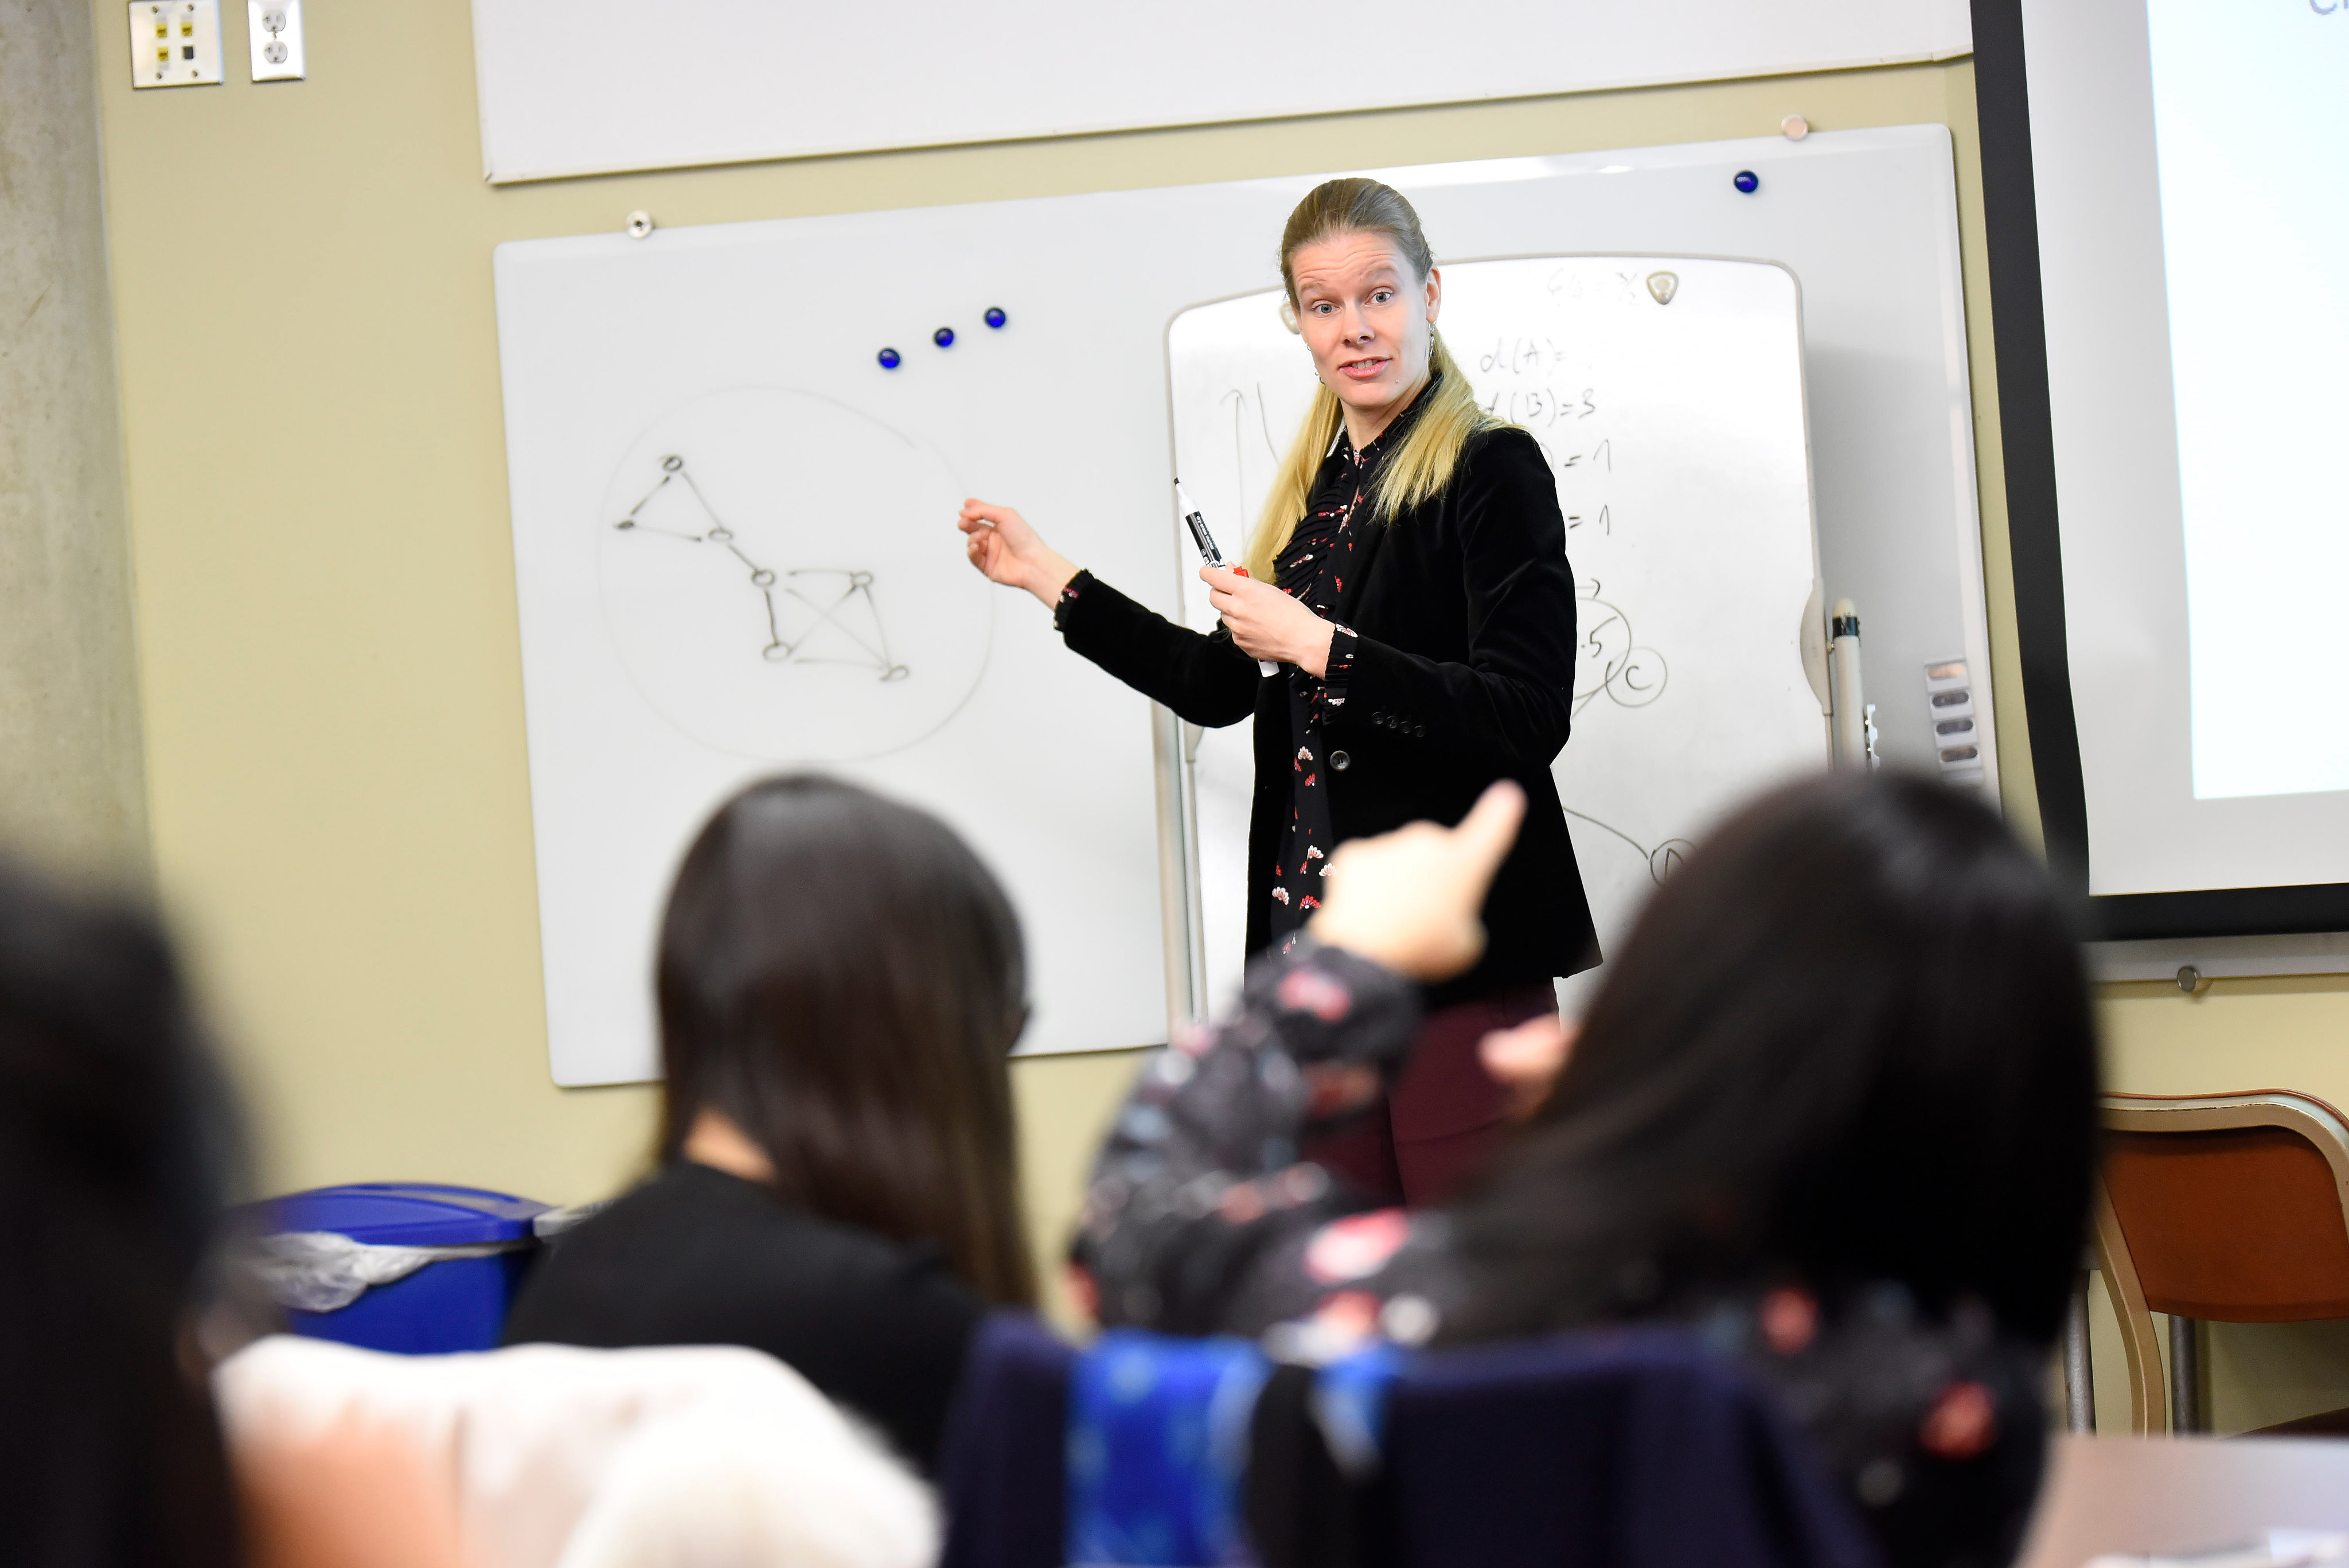
“Big data” has become a ubiquitous buzz phrase, but the course proved that it has the potential to predict market trends for creative products. Horvat is an assistant professor who works at the Northwestern Institute on Complex Systems and specializes in topics like collective intelligence, crowdfunding, and the creative industries. She brought her education, experience, and expertise to MSLCE students to help them explore applying analytics and data to their chosen creative field.
Student Chad Hewitt described the course as “a very high level overview of all of the tools and resources that one can use to analyze data in order to predict trends and cultural phenomena.” He added that the ability to “visualize networks and break them down and use them to look at demographics and market research” would mean that “when someone presents data to us we know how to…extrapolate the important information.”
Students learned and practiced using software programs like IBM’s Watson Analytics, Google Trends, and Gephi (a class favorite), and applied them to topics like digitization, social influence, networks, machine learning, and crowds. Weekly course assignments asked the students to answer questions like “how much time will it take approximately until everyone in the U.S. has heard who is the 2017 Literature Nobel Prize recipient?” or “how would you invest $1 million…knowing that the class will evaluate your decision?”
Students have expressed their appreciation for the progressive course content, and are looking forward to applying new skills in their career. Wenjie Xue noted that “there is data telling me that there is another way to analyze what I see in the culture and entertainment industry.”
As a creative, Michelle Gatesy wasn’t sure about approaching a data science-heavy course: “When I signed up I had no idea what I was in for…because I am not a numbers person by any stretch of the term. But my worries were calmed a little bit after the professor told us…we’re going to learn about how different types of data and different ways of interpreting data can help us learn more about our industries and learn about concrete things we can do to be more responsive as administrators.”
It is apparent that the course stretched the students and left them engaged and enlightened.